More Holders, Little Trading: The RWA Liquidity Problem Is Worse Than You Think

More Holders, Little Trading: The RWA Liquidity Problem Is Worse Than You Think

Let me ask you something straight. Does real-world asset trading on crypto exchanges feel like a genuine revolution, or does it feel like a warehouse full of boxes nobody opens? I think you know the answer.

The RWA sector has a serious liquidity problem, and saying it out loud shouldn’t make anyone uncomfortable. The numbers tell the story better than any narrative can.

The Scale of the Liquidity Gap

Start with the scale of the gap. Pantera Capital’s September 2026 report surveyed 671 tokenized assets worth a combined $331.8 billion. Permissioned products, the kind that require whitelisting and approval to hold, make up 59% of the total market cap. They contribute exactly 0.2% of spot trading volume. Read that again.

More than 50% of this sector’s value barely moves. Open-access products account for 41% of market cap and generate 99.8% of all spot trading. The sector splits cleanly into two worlds. One world trades. The other sits still.

BlackRock’s BUIDL fund offers the clearest illustration. The fund holds $2.77 billion across 10 chains. It has 106 investors and recorded just 191 transfers in a single month. That’s roughly six transfers per day for a multi-billion-dollar product.

Franklin Templeton’s BENJI fund reported 562 holders and $0 in monthly transfer volume. Compare that velocity with stablecoins, which turn over roughly 21 times their float every month. BUIDL turns over 0.12 times. That is a 180-fold gap in how much these assets actually move.

The IMF weighed in with its October 2026 Global Financial Stability Report, and the findings deserve attention. IMF staff described tokenized markets as small, fragmented, relatively illiquid and roughly 1.5 times more volatile than traditional counterparts. Most tokenized activity happens in repurchase agreements, which average $300 billion to $350 billion in daily volume.

Everything else, including credit, money market funds and tokenized equities, adds just $65 billion. To put that in perspective, the US repo market alone trades about $13 trillion daily. The entire tokenized universe outside repos represents a rounding error against traditional finance.

Holder Growth Does Not Equal Liquidity

Now here comes the counterargument, and it has real data behind it. BNB Chain’s RWA holder count crossed 2 million in early October 2026, reaching 2,032,387 addresses, up 15.56% in just 30 days.

Tokenized stockholders across all chains hit 4.3 million by late September, a 43-fold increase in a single year. BNB Chain alone holds 39% of all on-chain RWA holders. These growth rates look spectacular. They also demand context.

Holder counts and trading depth are entirely different things. Only 29 of 110 major tokenized products, those with market caps above $10 million, meet even basic thresholds for both liquidity and distribution. That is roughly 26%. More than 50% of the analysed market shows no meaningful secondary trading activity.

Why Some Tokenized Assets Trade Better

Tokenized gold stands as the exception that proves the rule. PAXG and XAUT together generated $90.7 billion in Q1 2026 spot volume, surpassing the full-year 2025 total of $84.64 billion. Average monthly spot volumes reached $5.72 billion for PAXG and $5.32 billion for XAUT.

Gold works because it has natural turnover, broad appeal and deep market-maker interest. Tokenized treasuries do not work the same way because they function as buy-and-hold instruments. The Pantera data shows tokenized stocks achieving 204.6% monthly turnover while rate products languish at 0.1%. The asset class determines the liquidity profile, not the blockchain.

Turnover rates for tokenized stocks hit 204.6% in June, making them the most actively traded RWA category. The market is not uniformly illiquid. The problem is concentrated in the market-cap-dominant products. Tokenized treasuries grew from $13 billion to $16.5 billion between Q1 and Q2 2026, yet they generate almost no secondary trading.

Private credit expanded from $4.1 billion to $5.1 billion, with similarly low turnover. The biggest, most institutional products are precisely the ones that do not trade.

Metric / Feature

Tokenized Stocks

Tokenized Rate Products

Monthly Turnover

204.6%

0.1%

Investor Behaviour

Active trading, speculation, hedging and high velocity.

Buy-and-hold, capital preservation and yield-earning.

Liquidity Profile

High velocity; ownership changes hands multiple times a month.

Low velocity; capital sits quietly until maturity or remains in a long-term allocation.

Table: Tokenized Stocks vs. Tokenized Rate Products

Issuance Is Easy, but Liquidity Is Not

This is the inflated part. Issuance has become easy. Wrapping a treasury bill or a stock into a token requires technical work, not a market miracle. Creating a liquid secondary market demands market makers, regulatory clarity, interoperable venues and genuine demand from traders who want to buy and sell continuously.

Those pieces do not exist yet for most RWAs. The Tokenization Preparedness Index, which Pantera introduced to measure how natively an asset operates on-chain, scored just 2.04 out of a possible higher range across the sample. Most assets are simple wrappers, not native instruments.

Look at where actual trading activity concentrates. Tokenized stock perpetual futures on platforms like Hyperliquid generated $67.8 billion in June volume, 16 times the spot market for the underlying tokens. Traders prefer derivatives because they offer leverage, easier shorting and liquidity from concentrated market-making.

The spot tokens themselves remain thin. This pattern mirrors how crypto markets developed for native assets, and it suggests the RWA spot market will eventually catch up. It also confirms that the spot market isn’t where the action is right now.

Adoption Is Real, but Depth Remains Limited

I believe the run is real. Tokenization solves genuine problems around settlement speed, fractional ownership and 24/7 access. The IMF found that more than 50% of tokenized equity trading occurs outside traditional market hours and that roughly 80% of the analysed trades were for fewer than one share, suggesting retail investors are using these products to access opportunities they could not otherwise access.

That is meaningful adoption. But meaningful adoption of a product does not equal deep, reliable liquidity. A user who buys a fractional share and holds it contributes to the holder count without adding to market depth.

A more sustainable version of this sector, which I expect to see within two to three years, will look different. Open-access tokens will dominate trading, not permissioned ones. RWAs will find routine use as collateral in DeFi lending, a trend already visible on platforms like Morpho, where private credit leads utilisation.

Market makers will build hybrid venues that connect centralised exchange order books with on-chain pools. Clearer regulation in major jurisdictions will reduce the friction that currently keeps assets locked behind whitelists. The Tokenization Preparedness Index will rise as products become more native and less wrapper-like.

The Next Run Needs Better Market Structure

The current phase is a beginning, and beginnings are messy. As Jeff Yan from Hyperliquid put it: “Overrated”.

I believe the start needs to be better, not because the technology fails, but because the market structure around it has not caught up. When it does, the next run will rest on trading depth rather than holder inflation. That run will last longer and matter more.


 

Anndy Lian is an early blockchain adopter and experienced serial entrepreneur who is known for his work in the government sector. He is a best selling book author. The latest book is Web4: The Age of Autonomous Intelligence.

j j j

Bitcoin’s $82,000 Bounce: Did Trump’s Iran Pledge Stop the Bleed?

Bitcoin’s $82,000 Bounce: Did Trump’s Iran Pledge Stop the Bleed?
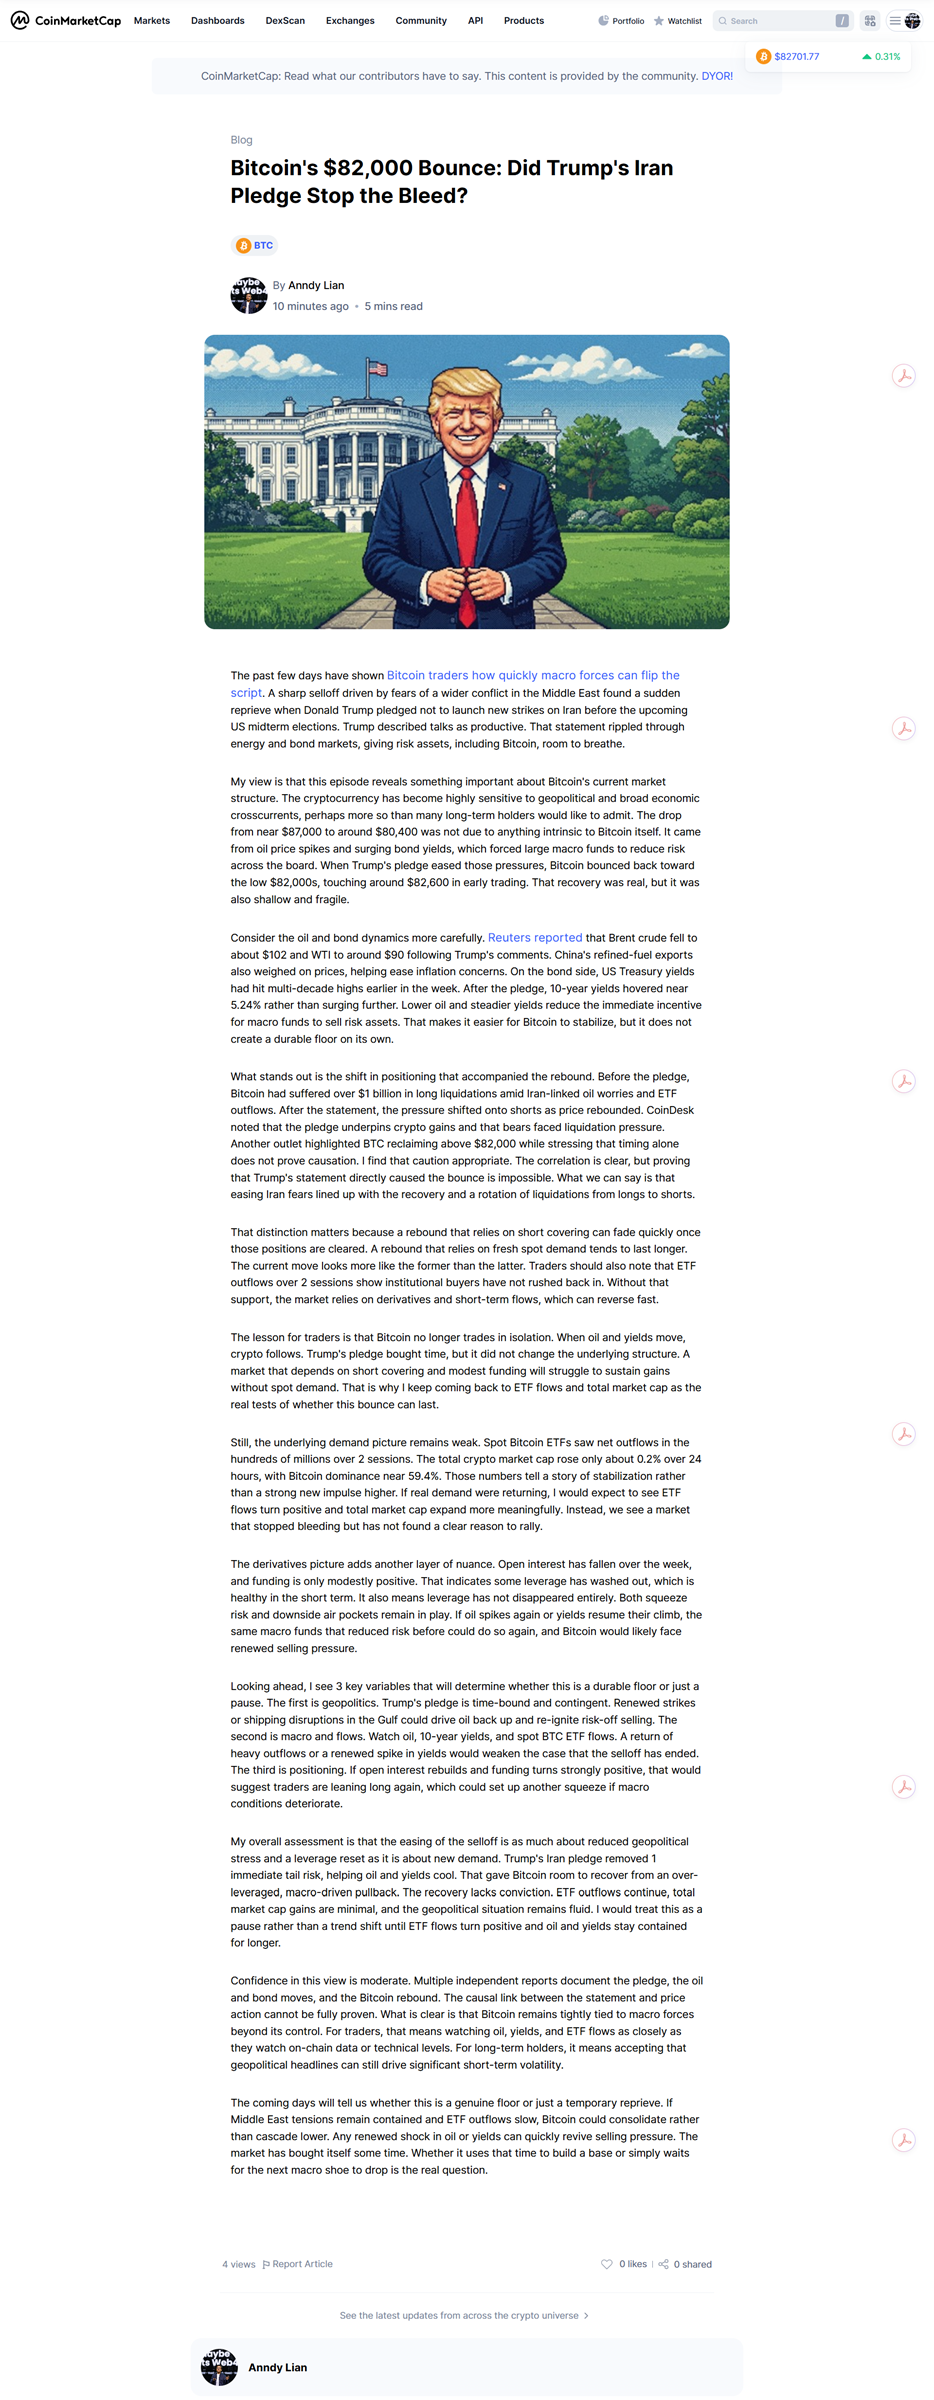
The past few days have shown Bitcoin traders how quickly macro forces can flip the script. A sharp selloff driven by fears of a wider conflict in the Middle East found a sudden reprieve when Donald Trump pledged not to launch new strikes on Iran before the upcoming US midterm elections. Trump described talks as productive. That statement rippled through energy and bond markets, giving risk assets, including Bitcoin, room to breathe.

My view is that this episode reveals something important about Bitcoin’s current market structure. The cryptocurrency has become highly sensitive to geopolitical and broad economic crosscurrents, perhaps more so than many long-term holders would like to admit. The drop from near $87,000 to around $80,400 was not due to anything intrinsic to Bitcoin itself. It came from oil price spikes and surging bond yields, which forced large macro funds to reduce risk across the board. When Trump’s pledge eased those pressures, Bitcoin bounced back toward the low $82,000s, touching around $82,600 in early trading. That recovery was real, but it was also shallow and fragile.

Consider the oil and bond dynamics more carefully. Reuters reported that Brent crude fell to about $102 and WTI to around $90 following Trump’s comments. China’s refined-fuel exports also weighed on prices, helping ease inflation concerns. On the bond side, US Treasury yields had hit multi-decade highs earlier in the week. After the pledge, 10-year yields hovered near 5.24% rather than surging further. Lower oil and steadier yields reduce the immediate incentive for macro funds to sell risk assets. That makes it easier for Bitcoin to stabilize, but it does not create a durable floor on its own.

What stands out is the shift in positioning that accompanied the rebound. Before the pledge, Bitcoin had suffered over $1 billion in long liquidations amid Iran-linked oil worries and ETF outflows. After the statement, the pressure shifted onto shorts as price rebounded. CoinDesk noted that the pledge underpins crypto gains and that bears faced liquidation pressure. Another outlet highlighted BTC reclaiming above $82,000 while stressing that timing alone does not prove causation. I find that caution appropriate. The correlation is clear, but proving that Trump’s statement directly caused the bounce is impossible. What we can say is that easing Iran fears lined up with the recovery and a rotation of liquidations from longs to shorts.

That distinction matters because a rebound that relies on short covering can fade quickly once those positions are cleared. A rebound that relies on fresh spot demand tends to last longer. The current move looks more like the former than the latter. Traders should also note that ETF outflows over 2 sessions show institutional buyers have not rushed back in. Without that support, the market relies on derivatives and short-term flows, which can reverse fast.

The lesson for traders is that Bitcoin no longer trades in isolation. When oil and yields move, crypto follows. Trump’s pledge bought time, but it did not change the underlying structure. A market that depends on short covering and modest funding will struggle to sustain gains without spot demand. That is why I keep coming back to ETF flows and total market cap as the real tests of whether this bounce can last.

Still, the underlying demand picture remains weak. Spot Bitcoin ETFs saw net outflows in the hundreds of millions over 2 sessions. The total crypto market cap rose only about 0.2% over 24 hours, with Bitcoin dominance near 59.4%. Those numbers tell a story of stabilization rather than a strong new impulse higher. If real demand were returning, I would expect to see ETF flows turn positive and total market cap expand more meaningfully. Instead, we see a market that stopped bleeding but has not found a clear reason to rally.

The derivatives picture adds another layer of nuance. Open interest has fallen over the week, and funding is only modestly positive. That indicates some leverage has washed out, which is healthy in the short term. It also means leverage has not disappeared entirely. Both squeeze risk and downside air pockets remain in play. If oil spikes again or yields resume their climb, the same macro funds that reduced risk before could do so again, and Bitcoin would likely face renewed selling pressure.

Looking ahead, I see 3 key variables that will determine whether this is a durable floor or just a pause. The first is geopolitics. Trump’s pledge is time-bound and contingent. Renewed strikes or shipping disruptions in the Gulf could drive oil back up and re-ignite risk-off selling. The second is macro and flows. Watch oil, 10-year yields, and spot BTC ETF flows. A return of heavy outflows or a renewed spike in yields would weaken the case that the selloff has ended. The third is positioning. If open interest rebuilds and funding turns strongly positive, that would suggest traders are leaning long again, which could set up another squeeze if macro conditions deteriorate.

My overall assessment is that the easing of the selloff is as much about reduced geopolitical stress and a leverage reset as it is about new demand. Trump’s Iran pledge removed 1 immediate tail risk, helping oil and yields cool. That gave Bitcoin room to recover from an over-leveraged, macro-driven pullback. The recovery lacks conviction. ETF outflows continue, total market cap gains are minimal, and the geopolitical situation remains fluid. I would treat this as a pause rather than a trend shift until ETF flows turn positive and oil and yields stay contained for longer.

Confidence in this view is moderate. Multiple independent reports document the pledge, the oil and bond moves, and the Bitcoin rebound. The causal link between the statement and price action cannot be fully proven. What is clear is that Bitcoin remains tightly tied to macro forces beyond its control. For traders, that means watching oil, yields, and ETF flows as closely as they watch on-chain data or technical levels. For long-term holders, it means accepting that geopolitical headlines can still drive significant short-term volatility.

The coming days will tell us whether this is a genuine floor or just a temporary reprieve. If Middle East tensions remain contained and ETF outflows slow, Bitcoin could consolidate rather than cascade lower. Any renewed shock in oil or yields can quickly revive selling pressure. The market has bought itself some time. Whether it uses that time to build a base or simply waits for the next macro shoe to drop is the real question.


Source: https://coinmarketcap.com/community/articles/6ac9da8d1f531212d224a5dd/


Anndy Lian is an early blockchain adopter and experienced serial entrepreneur who is known for his work in the government sector. He is a best selling book author. The latest book is Web4: The Age of Autonomous Intelligence.

j j j

Bitcoin dropped from $86,500 to $81,000 in days. Are you worried?

Bitcoin dropped from $86,500 to $81,000 in days. Are you worried?

Key Points:

  1. Bitcoin trades $80,550 to $81,000, down 3.3% to 4% in 24h from $86,500. Ethereum trades $2,410 to $2,470, down 5.7% to 6% from above $2,700. Total crypto market cap fell 2.53% to $2.76T.

  2. Bitcoin drop below $77,000 triggered $303.08M in BTC long liquidations, a 62.97% surge. Volume rose 15.02% overall and 65.95% in derivatives. Excessive leverage turned a pullback into an accelerated decline.

  3. Ethereum fell 8.62% over 7d partly on fears AI could break elliptic-curve cryptography. NEAR fell 15.79% after a 91.61% 30d rally. ZEC fell 10.39% after a 567.13% 30d rally. Profit-taking hit overheated altcoins.

  4. Market tests Fibonacci 50% retracement at $2.76T. Next critical level is 61.8% at $2.71T. A break below could target swing low of $2.57T. Crypto shows 75% correlation with Nasdaq-100 (QQQ).


Bitcoin trades around $80,550 to $81,000. Ethereum trades near $2,410 to $2,470. Both assets dropped sharply on October 9, 2026. An aggressive deleveraging wave and broader macro risk-off sentiment drove the decline. Bitcoin fell about 3.3% to 4% over the last 24 hours. It dropped from weekly highs near $86,500. Ethereum fell about 5.7% to 6% over the same period. It retreated from weekly levels above $2,700. The total crypto market capitalization fell 2.53% to $2.76T in 24 hours. A massive liquidation cascade primarily drove this move. The crypto market shows a 75% correlation with the Nasdaq-100 (QQQ). That correlation signals a shared macro-driven move. This sell-off is not isolated. It reflects a broader risk-off mood across financial markets. Investors have shown little appetite for speculative positions in this environment. The crypto sector is feeling the same pressure that weighs on technology stocks and other risk assets.

The primary reason for this sell-off is a concentrated wave of long liquidations. Bitcoin led the forced closures. More than $300M in leveraged positions disappeared. The drop below $77,000 triggered a concentrated liquidation wave. Over 24 hours, $303.08M in BTC long positions faced forced closure. That figure marks a 62.97% surge from the prior period. This forced selling in the largest asset spilled over and pressured the entire market. Excessive leverage acted as fuel. It turned a routine pullback into an accelerated decline. High volume spiked 15.02% overall. Derivatives volume spiked 65.95%. These volume spikes confirm panic selling and position unwinding. The cascade did not spare Ethereum. The second-largest asset suffered its own wave of liquidations. The entire crypto ecosystem felt the aftershock as traders rushed to reduce exposure.

Traders should watch for a sustained drop in open interest and funding rates. Such a drop would signal that deleveraging is cooling. Until that happens, prices remain vulnerable to further bouts of forced selling. The current environment rewards caution. Excessive leverage built up in the system over recent weeks. That leverage created a fragile structure. When prices dipped below key thresholds, the structure collapsed. The high volume confirms that many participants exited positions in a hurry. Panic selling often marks a short-term bottom. It can also precede further declines if support levels fail. The next few sessions will reveal whether the deleveraging has run its course. A calm derivatives market would provide the first real sign of stability. Until then, every rally attempt faces the risk of another liquidation cascade.

Secondary pressures came from sector-specific worries. Ethereum fell 8.62% over 7d. Fears that artificial intelligence could break elliptic-curve cryptography partly drove that drop. Coinbase’s cryptographer debated this issue. The debate sparked concern among holders. At the same time, overheated altcoins saw sharp profit-taking. NEAR and ZEC corrected after extended rallies. NEAR fell 15.79%. ZEC fell 10.39%. Those declines followed massive 30d rallies. NEAR had gained 91.61%. ZEC had gained 567.13%. The sell-off was not monolithic. It combined technical profit-taking in overbought altcoins with nascent, fear-driven narratives about core blockchain security. These narratives added a new layer of uncertainty to an already fragile ecosystem. The AI cryptography discussion matters for the long term. In the short term, it gave traders another reason to sell. The debate itself is healthy. Panic selling based on it is not. Ethereum’s 8.62% 7d decline outpaced Bitcoin’s 24 hour drop, which shows altcoins carry more beta in this risk-off phase.

The near-term outlook hinges on key technical levels. The market is testing a key Fibonacci 50% retracement level at $2.76T. The immediate path depends on whether this support holds. The next critical level is the 61.8% retracement at $2.71T. Upcoming macro cues, such as the next FOMC decision, will influence broader risk appetite. A hold above $2.71T could lead to a period of consolidation and base-building. A break below that level would likely trigger another leg down toward the swing low of $2.57T. This risk is especially high if leveraged long positions rebuild too quickly and become vulnerable again. The asset class needs time to heal. It also needs a calmer macro backdrop. The correlation with the Nasdaq-100 means crypto will struggle to rally if technology stocks remain under pressure. The $2.76T level matters as the first test. The $2.71T level matters as the last line of defense before $2.57T.

In my view, this downturn is a violent deleveraging event. It is not a fundamental rejection of the asset class. Excessive leverage built up across BTC and altcoins. The liquidation cascade provided a brutal reset. The AI cryptography fears, while legitimate in the long run, have amplified short-term panic. The core technology behind Bitcoin and Ethereum remains sound. The cryptographic community continues to work on quantum-resistant solutions. The real risk is not that AI will break elliptic-curve cryptography tomorrow. The real risk is that fear over such a possibility could drive investors away from the asset class. The macro environment is the more pressing concern. As long as the Federal Reserve maintains a hawkish stance and geopolitical tensions simmer, crypto will struggle to mount a sustained recovery. The $2.71T level is the line in the sand. If it holds, we could see stabilization in the coming weeks. If it breaks, prices may need to retest their July lows. The pain could extend well into the final quarter of the year.

Market Outlook: Bearish Pressure. The downturn was primarily a violent deleveraging event. Sector-specific anxieties and profit-taking amplified it. The ability to stabilize now depends on holding key technical supports and avoiding another buildup of speculative long leverage. Will the $2.71T level hold, or is a retest of the July lows ahead? The answer will shape the direction of the crypto sector for weeks to come. For now, caution remains the order of the day.


Source:


Anndy Lian is an early blockchain adopter and experienced serial entrepreneur who is known for his work in the government sector. He is a best selling book author. The latest book is Web4: The Age of Autonomous Intelligence.

j j j